Introduction
The Quant Research Platform relies on a sophisticated feature engineering pipeline to transform raw market data into actionable insights. This pipeline processes VIX and SPY data to generate features like rolling returns, yield curve differentials, and sentiment scores, which are crucial for signal generation and trading execution.
Key Components
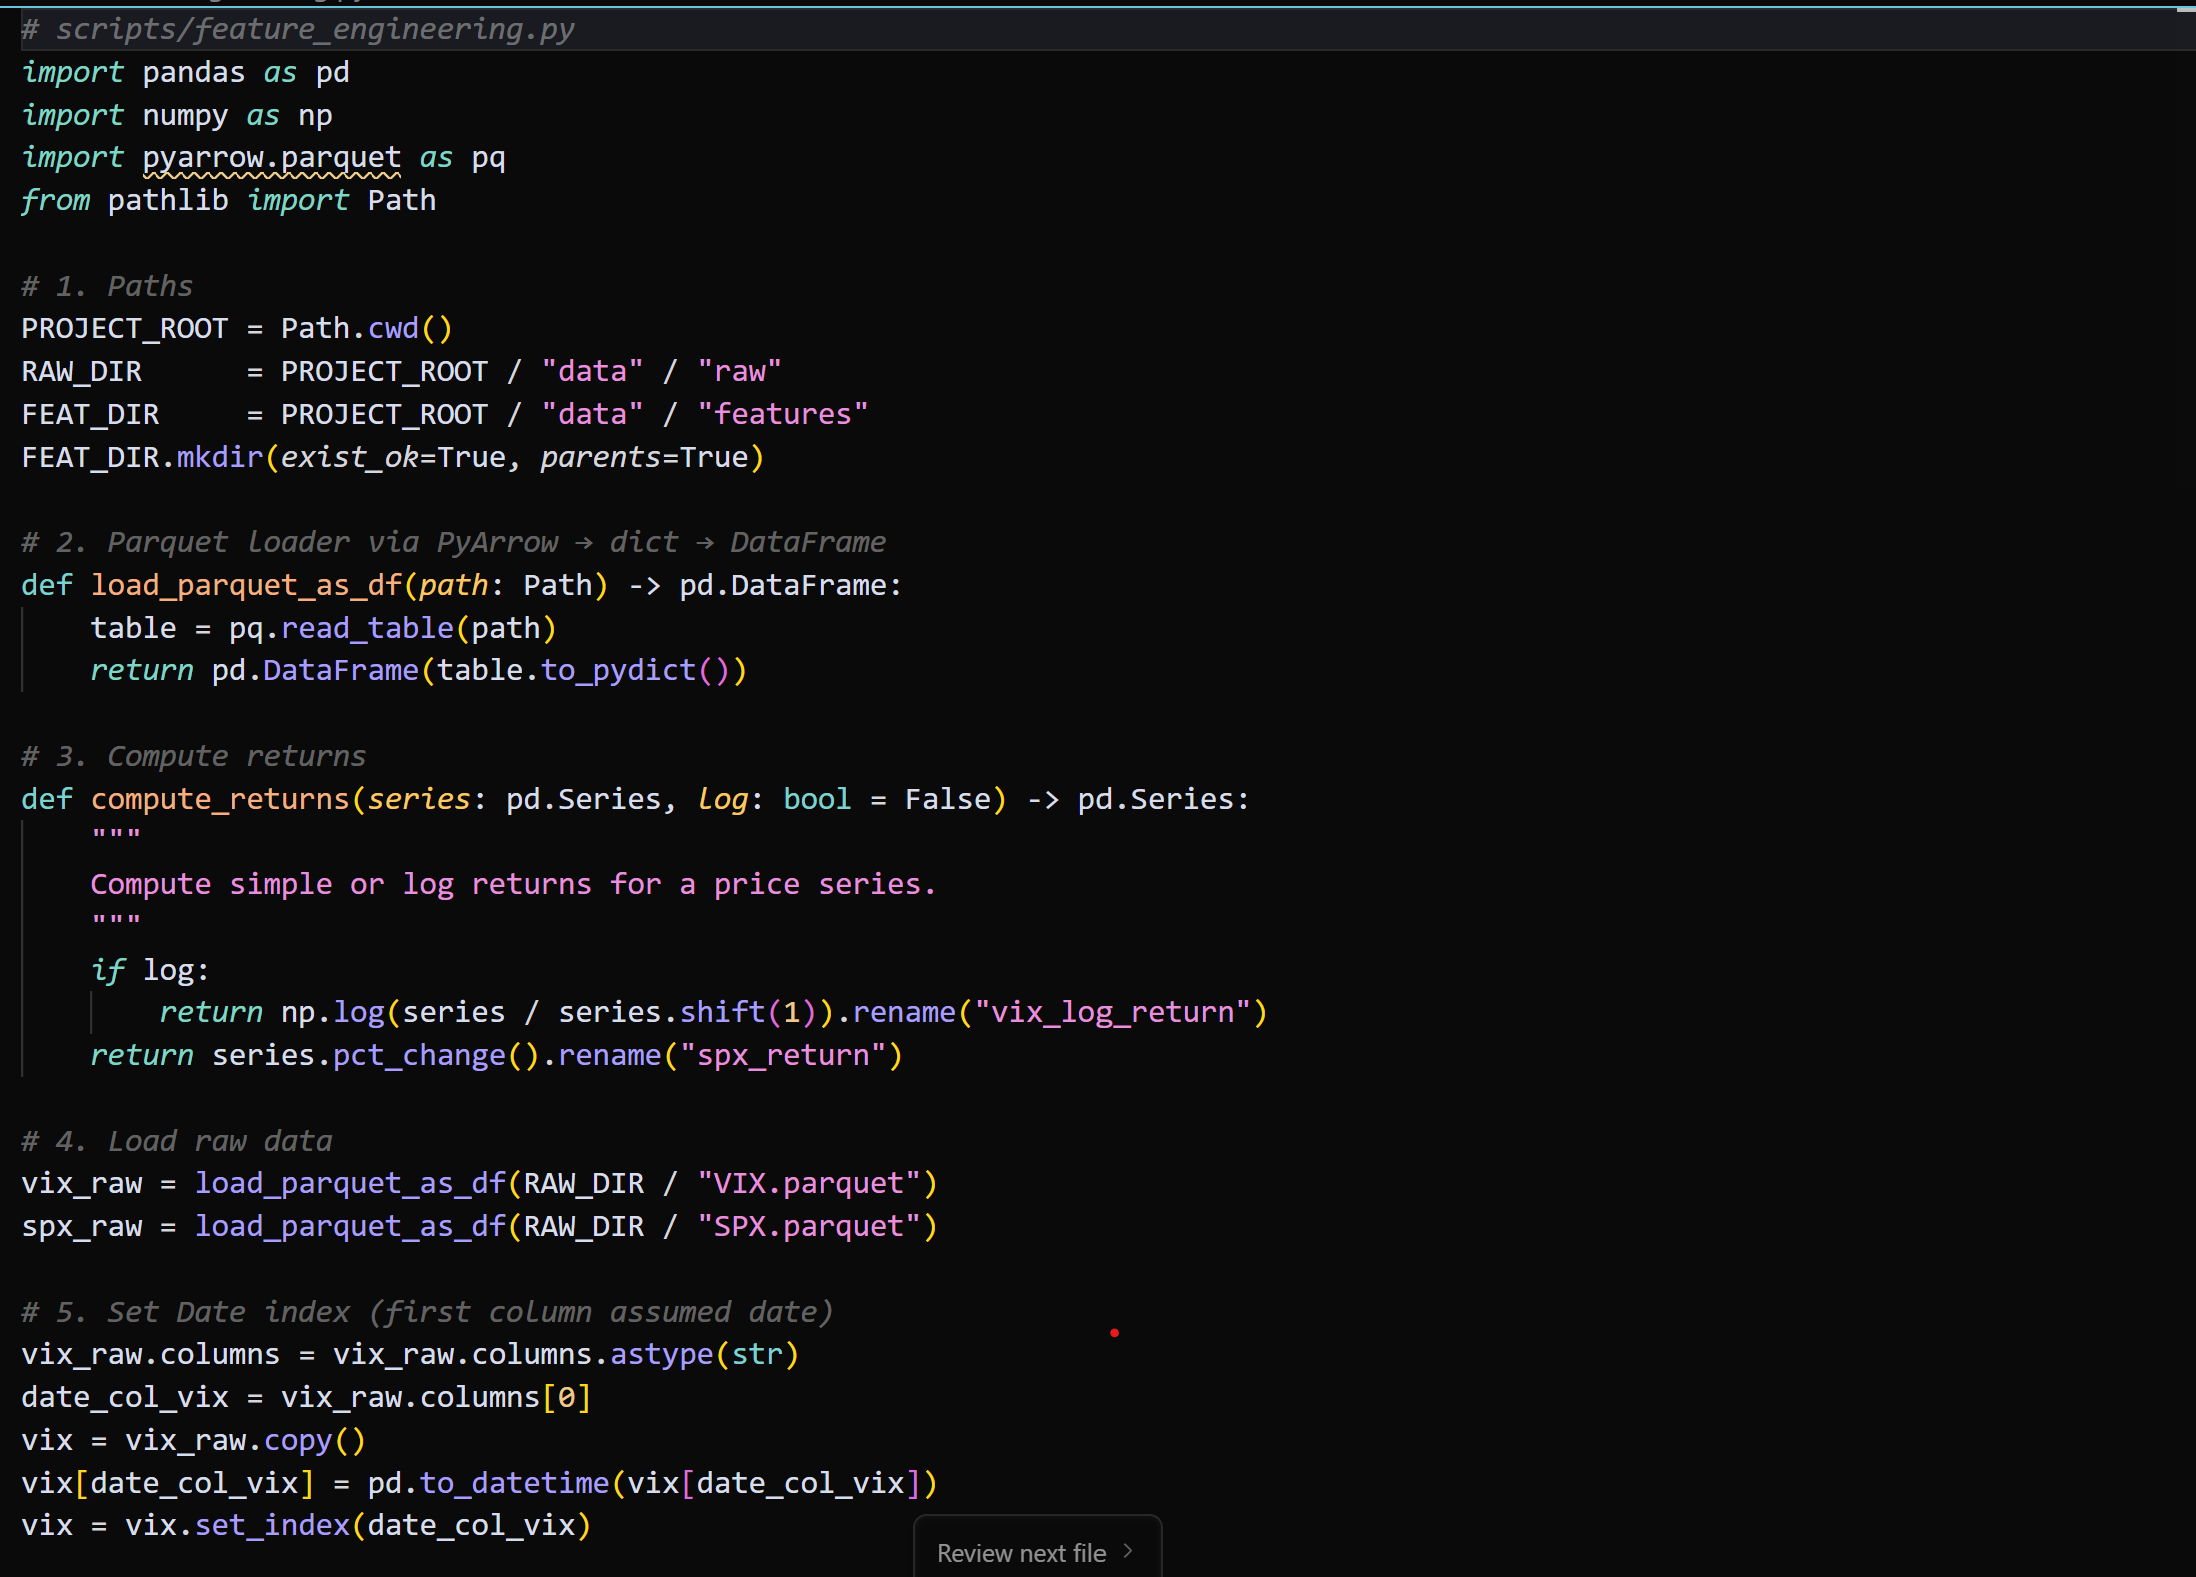
- Data Loading: Raw data (VIX, SPX) is loaded from Parquet files using PyArrow and Pandas.
- Returns Computation: Log returns for VIX and simple returns for SPX are computed to capture price movements.
- Rolling Statistics: Moving averages and volatilities are calculated over multiple time windows (5, 21, 63 days) to identify trends and risk.
- Yield Curve Differential: The difference between 10Y and 2Y Treasury yields is computed as a macroeconomic indicator.
- Sentiment Scores: A placeholder for future sentiment analysis, currently defaulting to zero.
- Feature Assembly: All features are combined into a single DataFrame, with missing values dropped, and saved to a Parquet file.
Mathematical Framework
Returns
- Log Returns:
- Simple Returns:
Rolling Volatility (Annualized)
Yield Curve Differential
Results
- The pipeline successfully transforms raw market data into actionable features.
- Features like rolling returns and yield curve differentials provide valuable insights for trading strategies.
- The modular design allows for easy integration of additional features or data sources.