Inthisone Dashboard
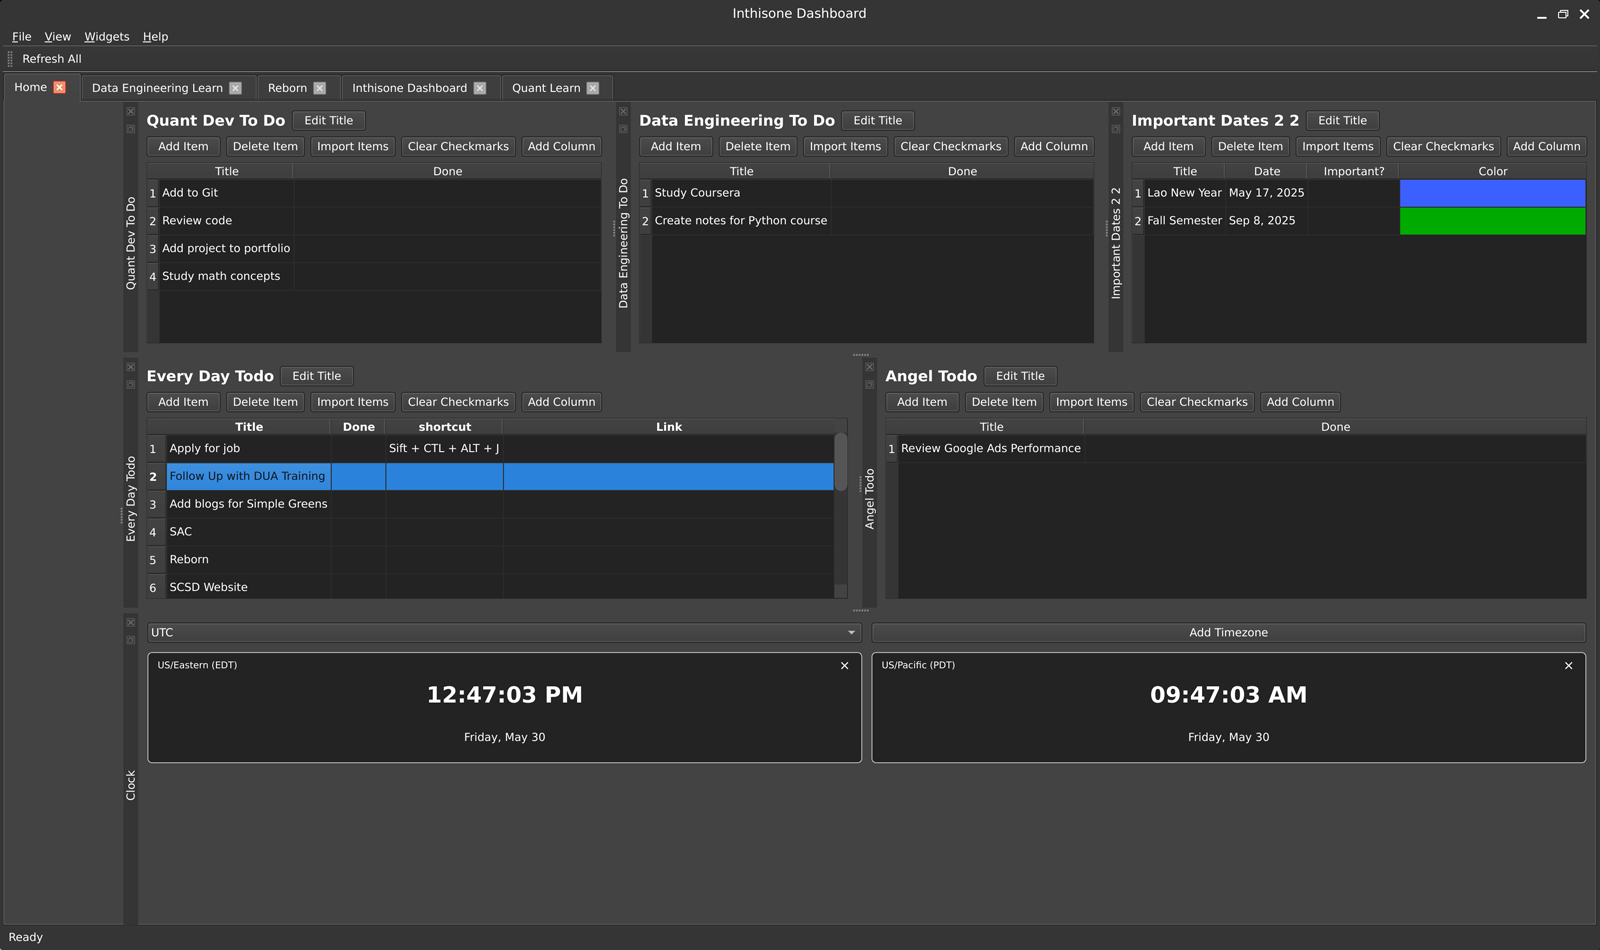
A desktop dashboard app I built to explore what it takes to visualize market data, indicators, and quant research tools in a self-built quant environment.
QuantPythonDashboard
View project details
A selection of systems and strategies I've developed. Each project reflects a real-world problem in quantitative finance and trading.
A desktop dashboard app I built to explore what it takes to visualize market data, indicators, and quant research tools in a self-built quant environment.
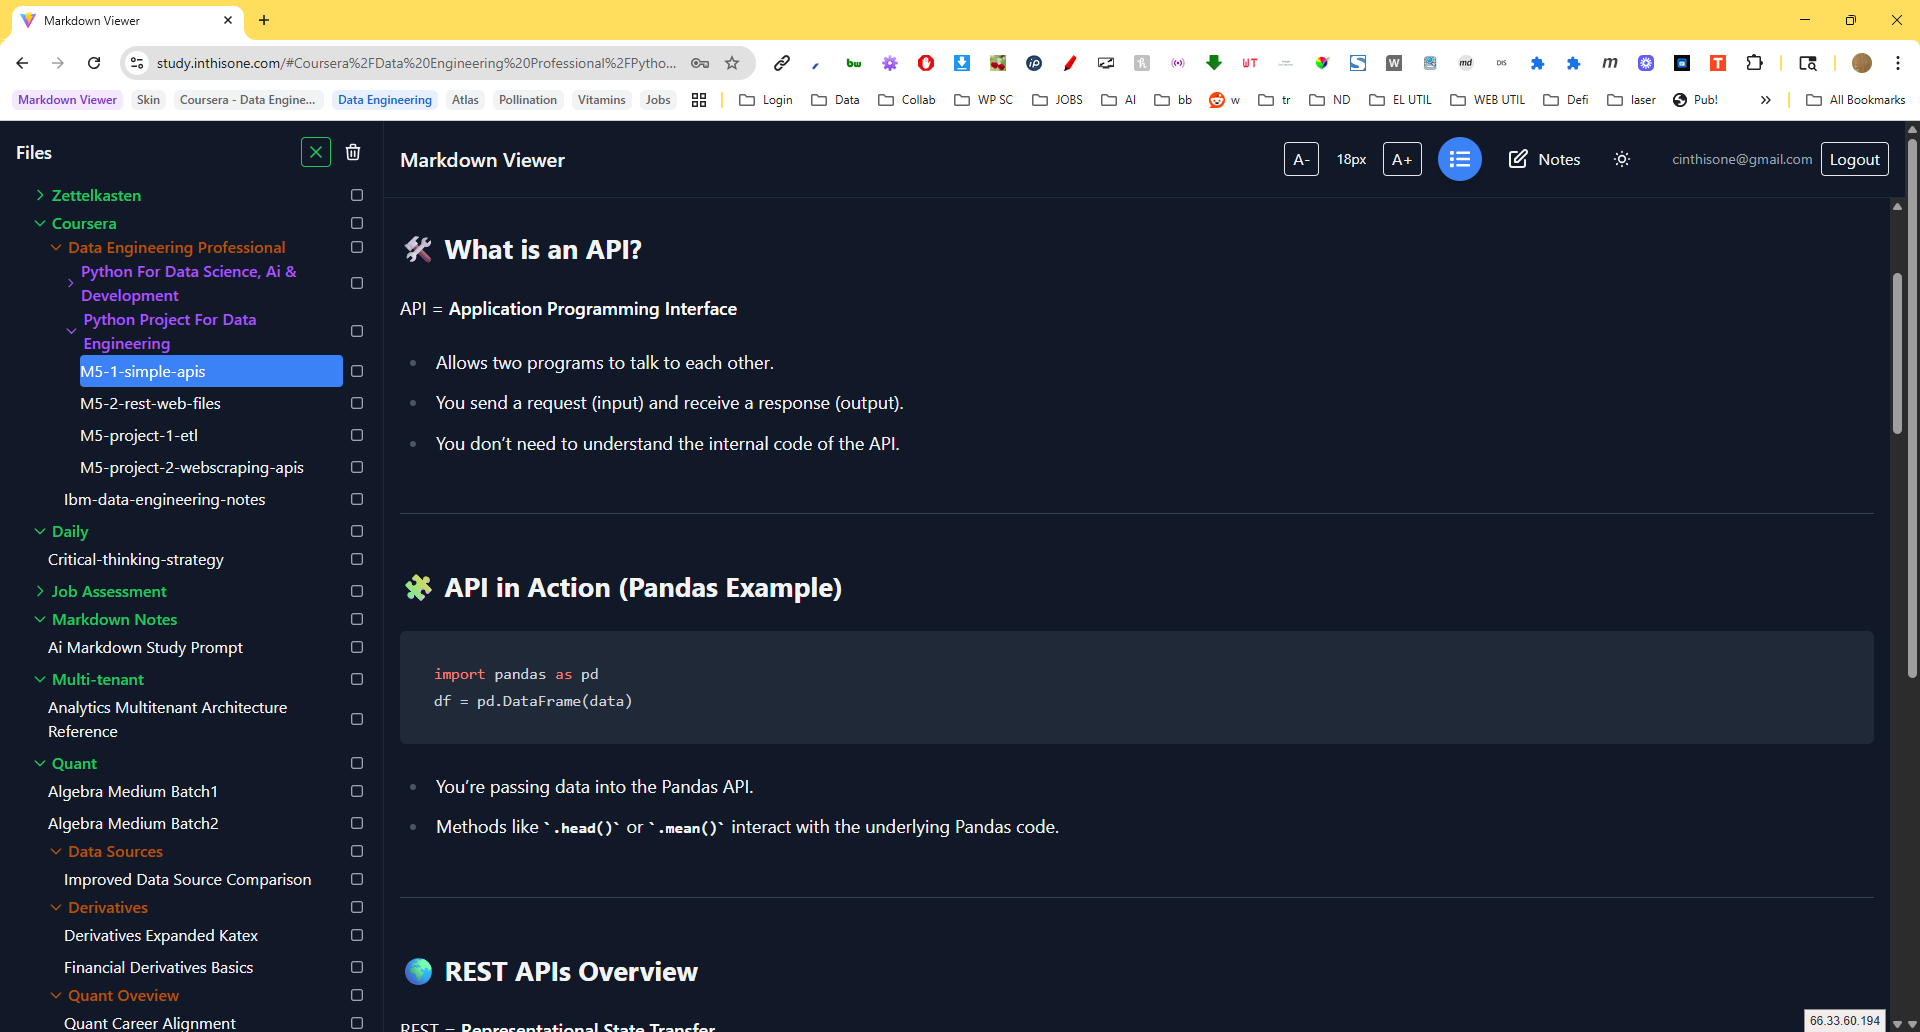
I built a markdown viewer with a tree structure, math and code support, and a todo system to organize my quant learning — then discovered Obsidian.
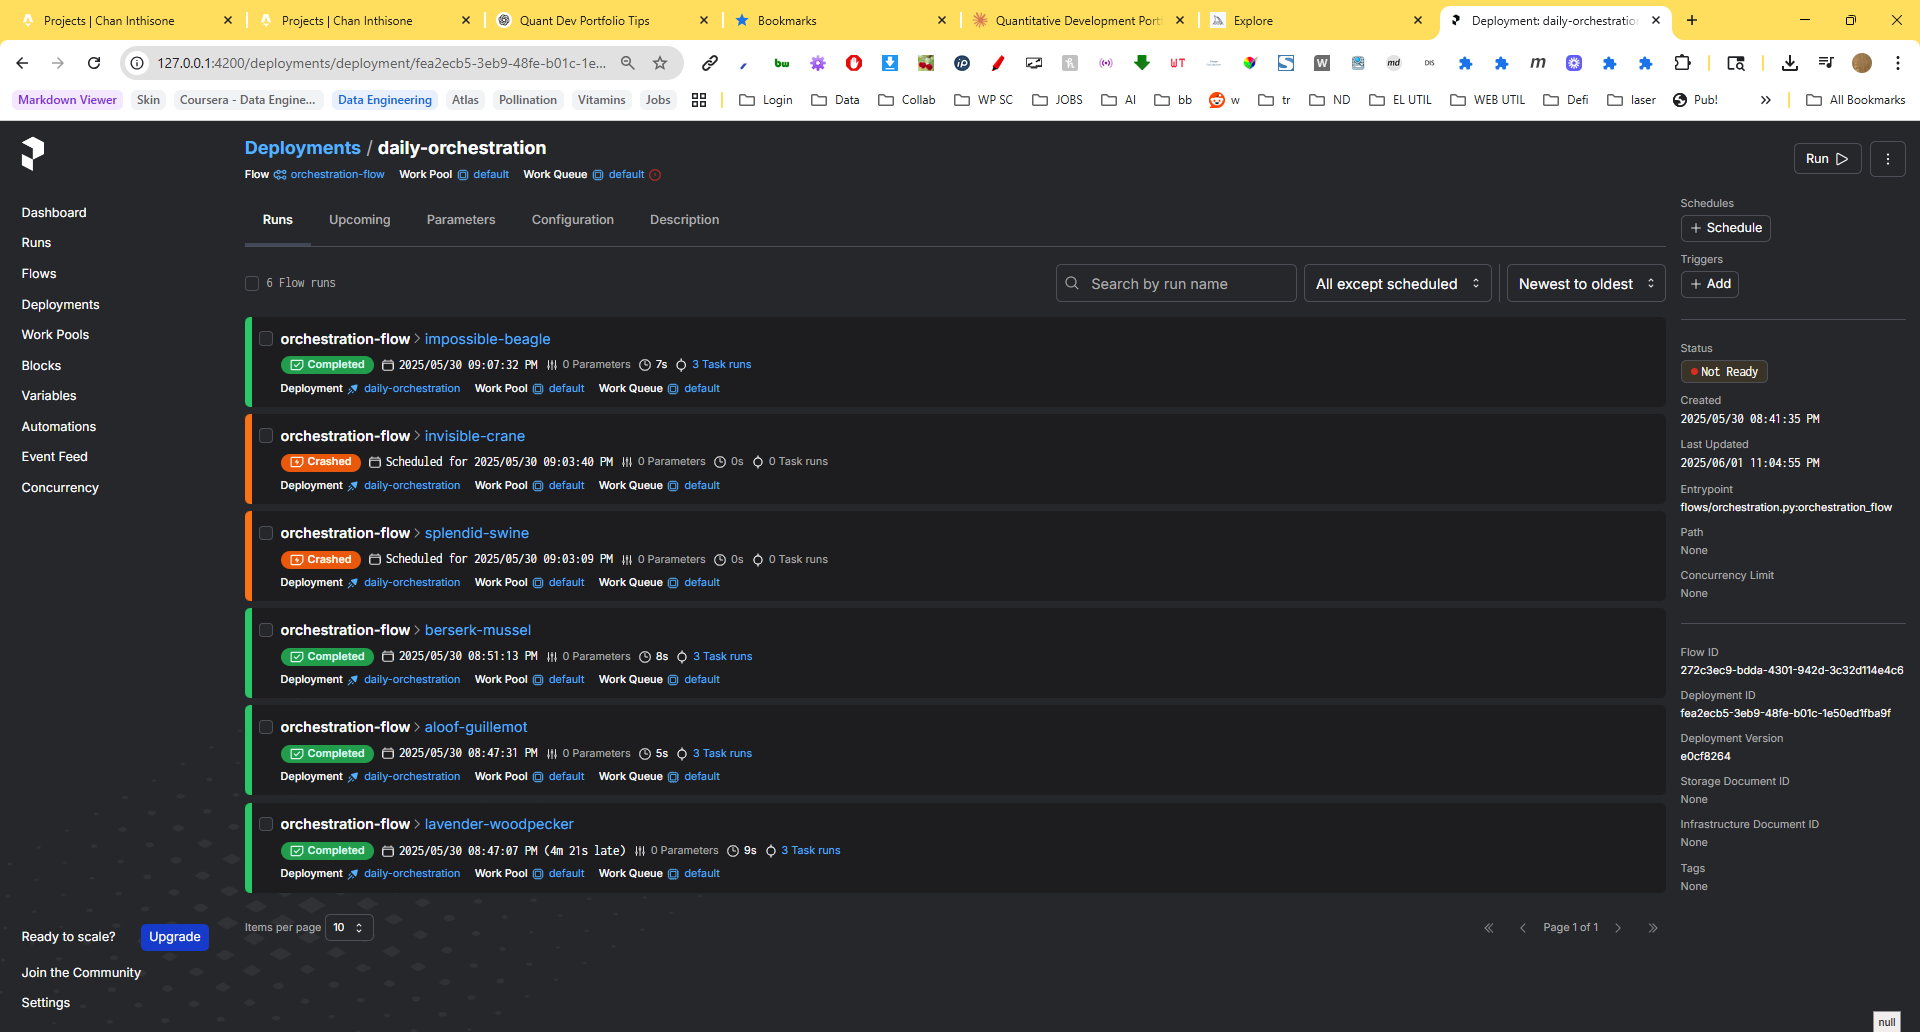
How I built the data ingestion layer for my quant research platform.
My journey building an end-to-end quant research pipeline.
A robmet data ingestion pipeline for collecting, processing, and storing market data (VIX, SPY) to fuel quantitative trading strategies.
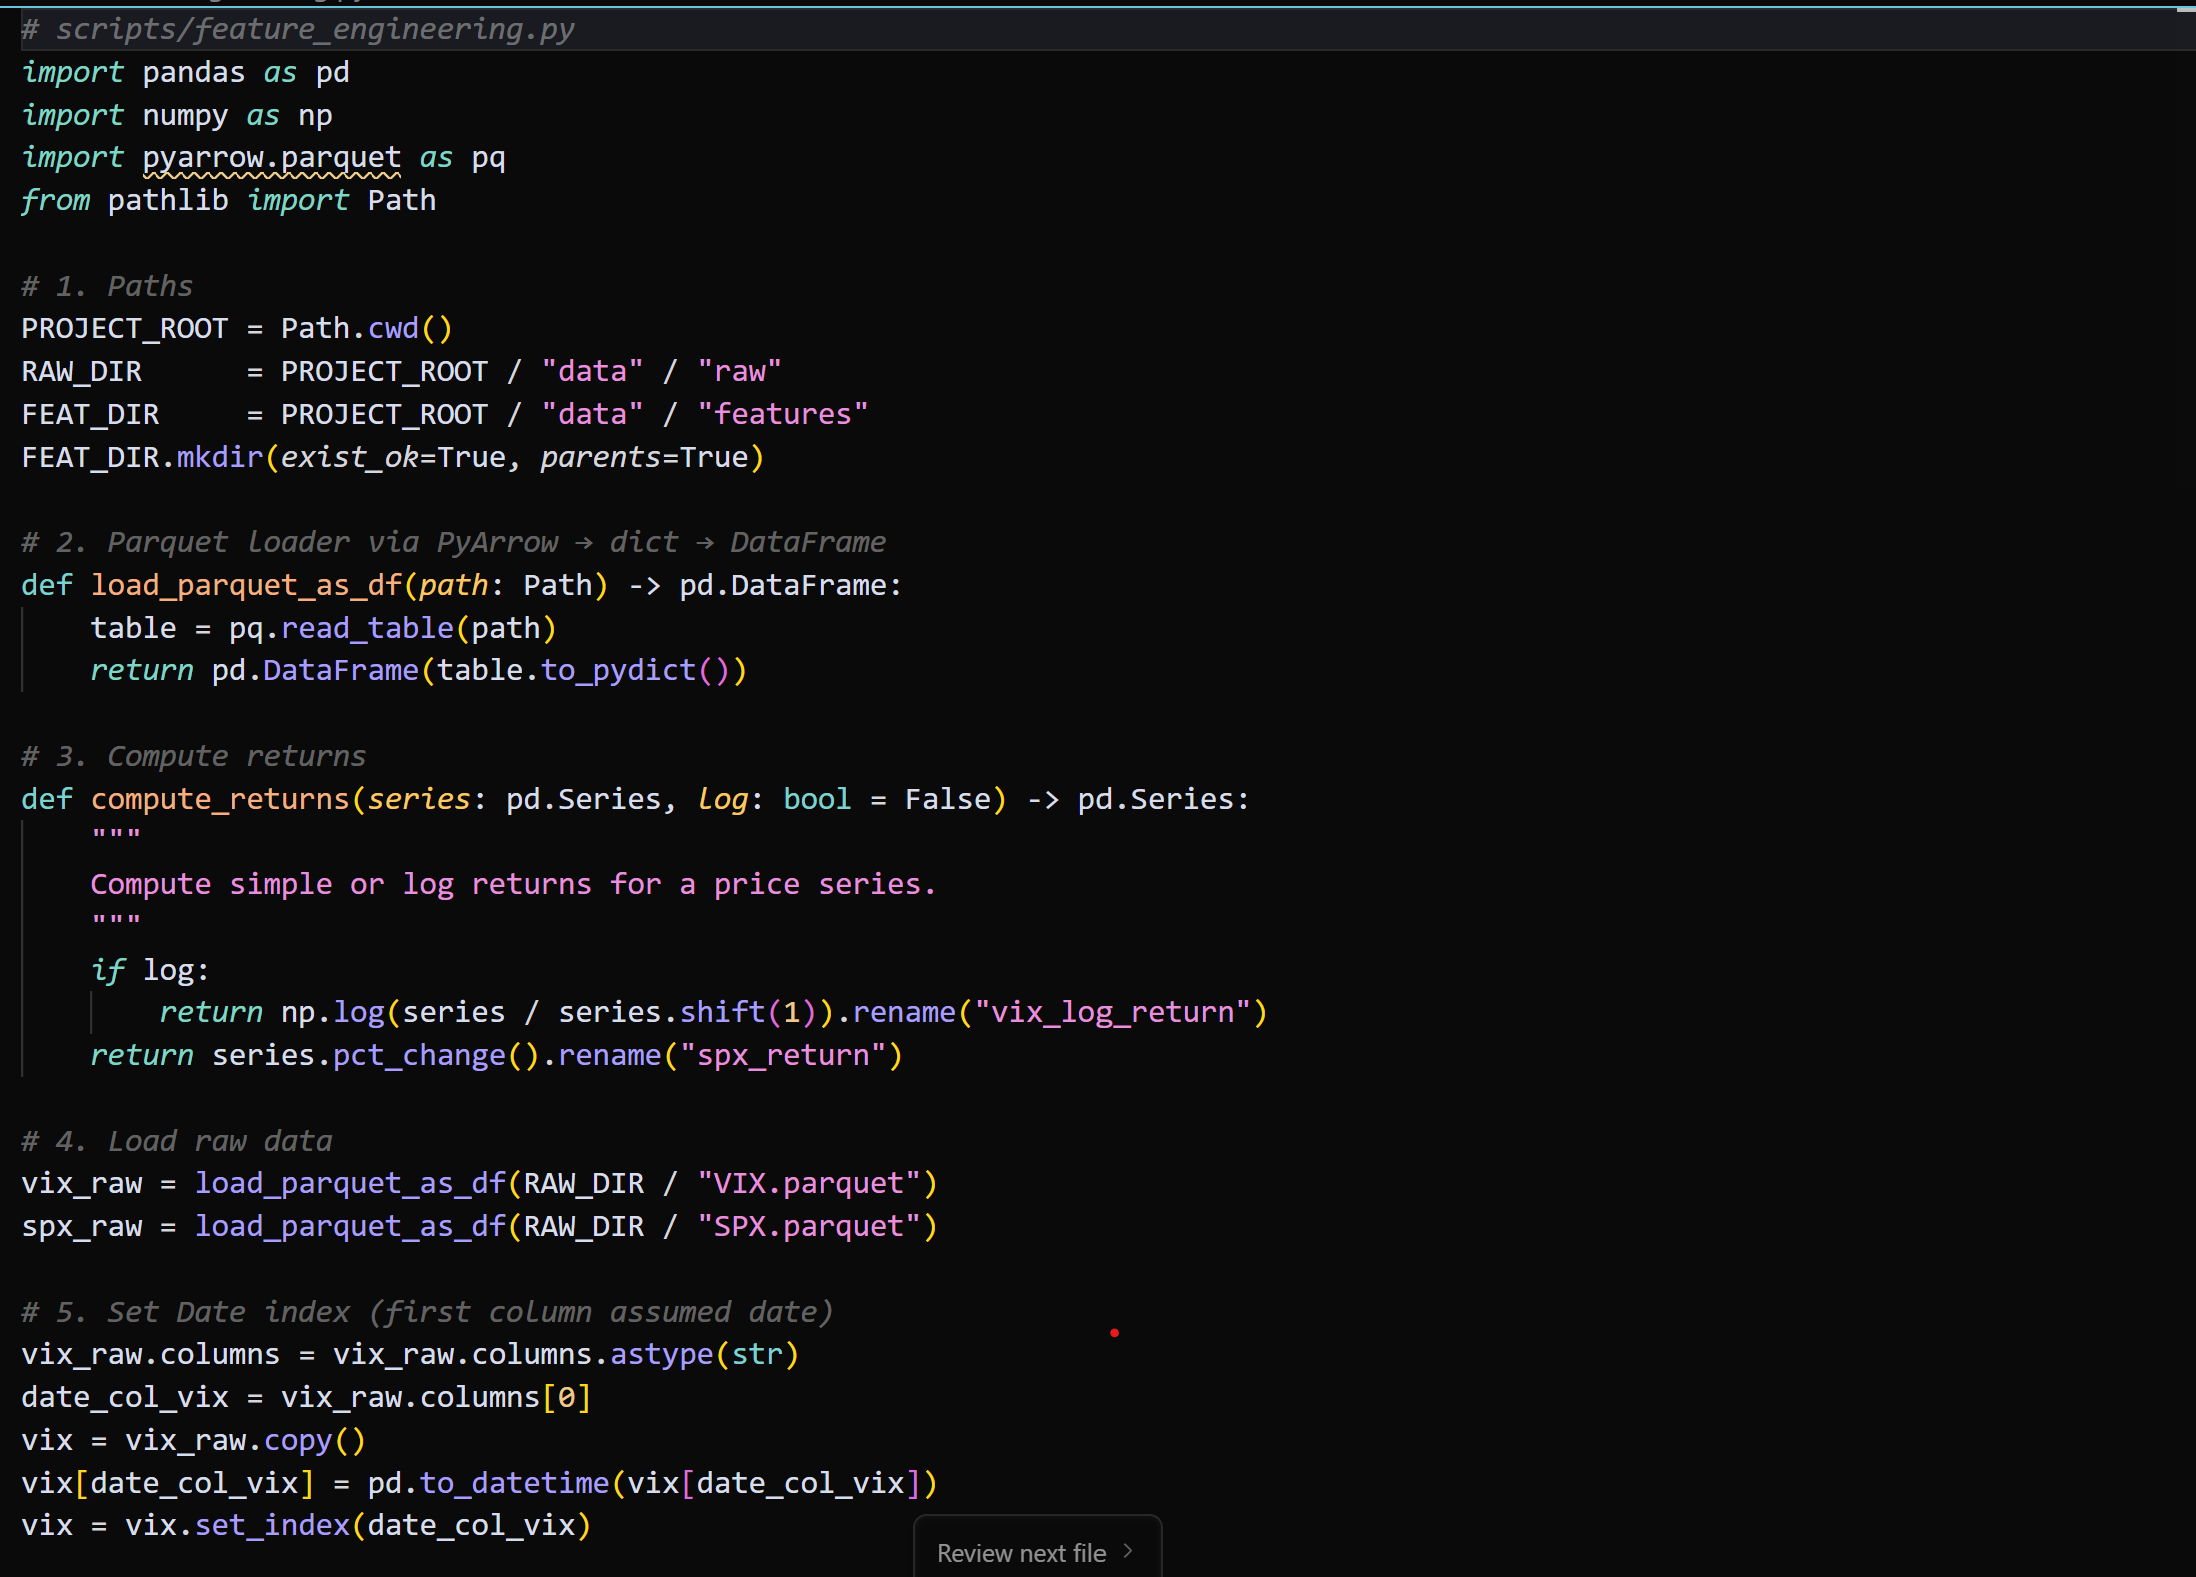
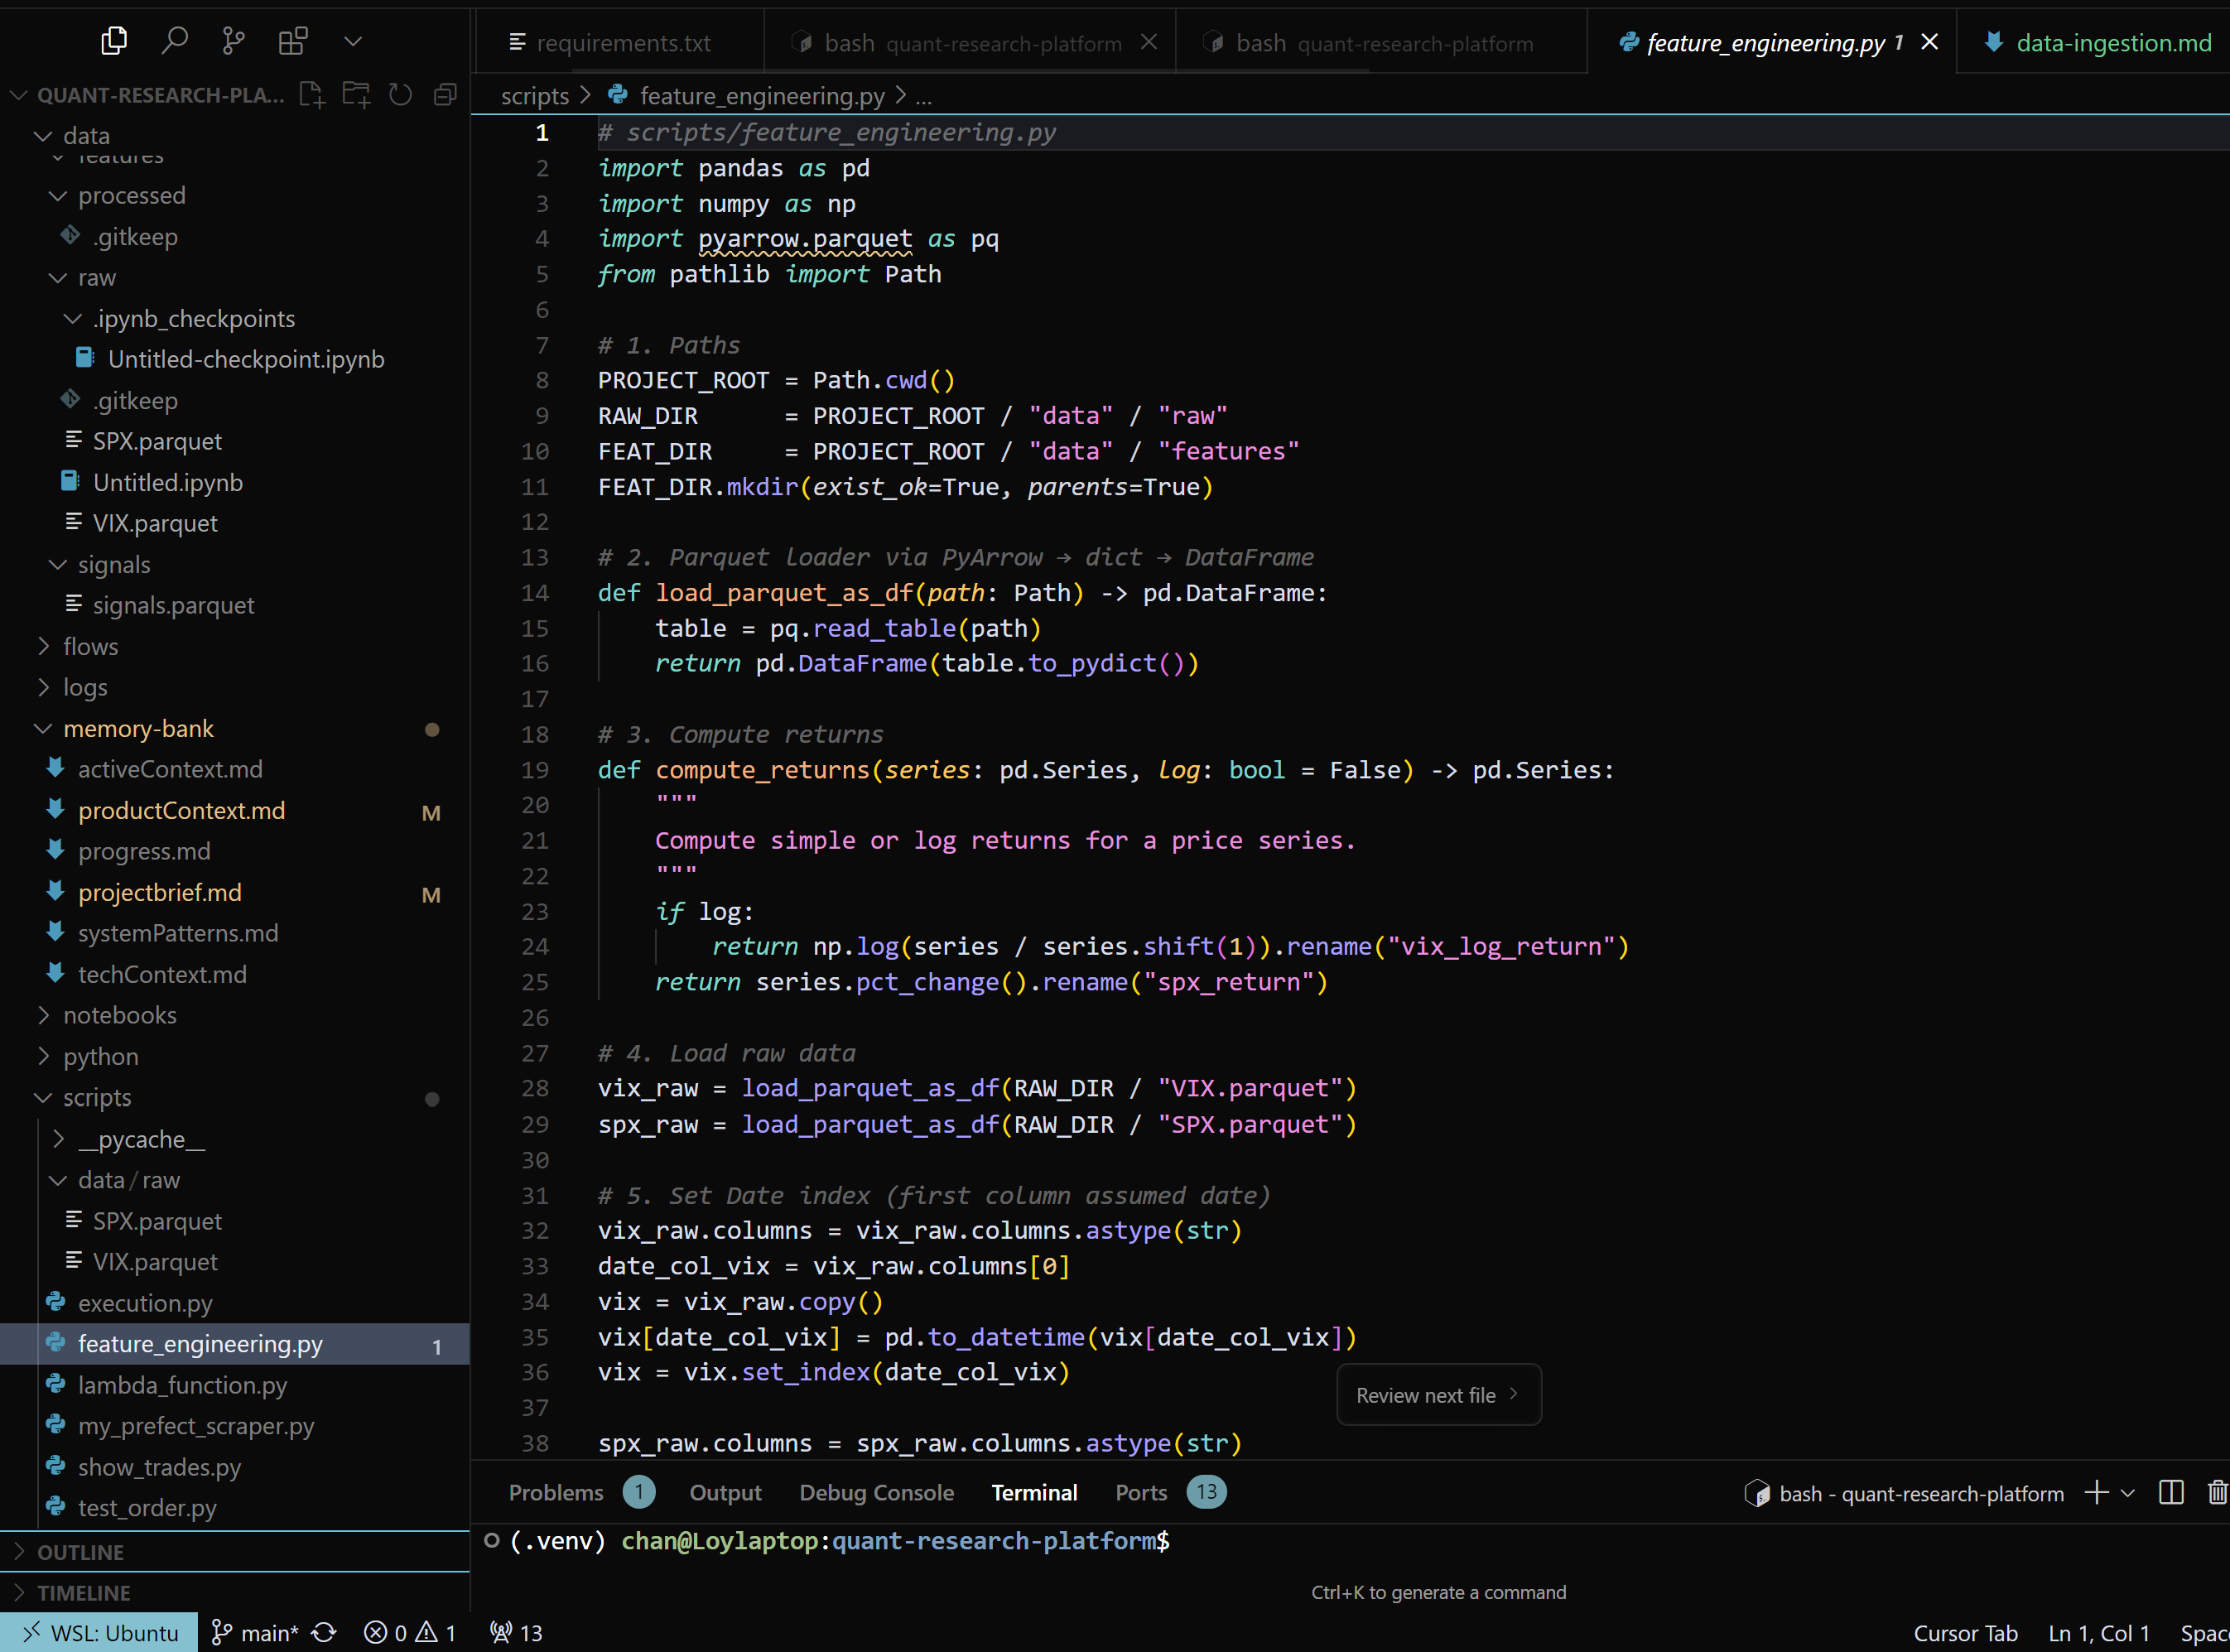
A robust feature engineering pipeline that transforms raw market data (VIX, SPY) into actionable features for quantitative trading strategies.
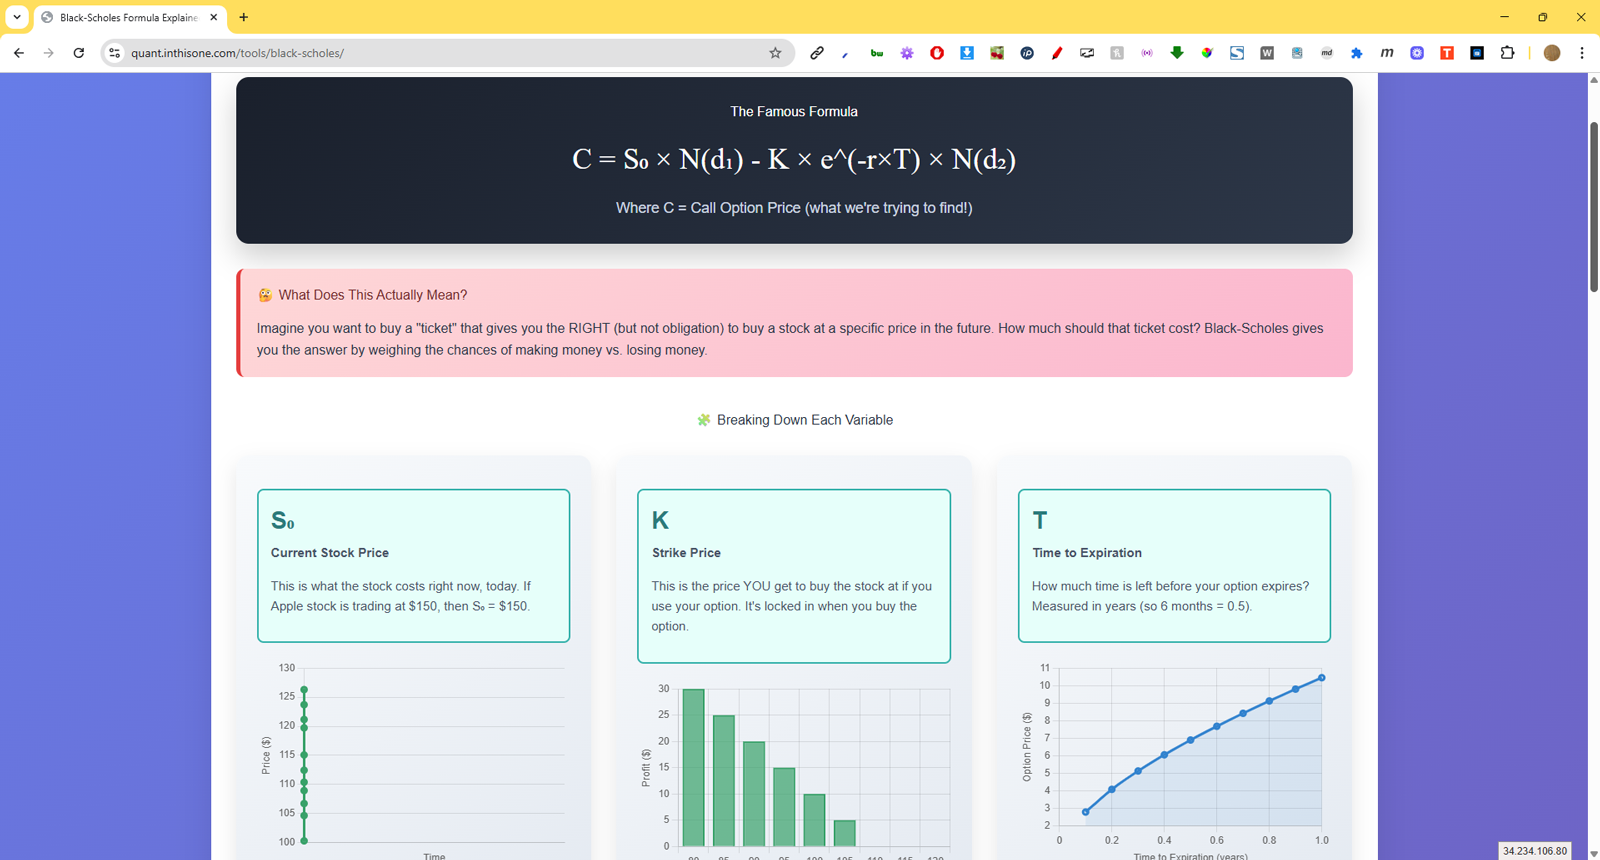
An interactive calculator for pricing European call and put options using the Black-Scholes model, built to deepen my understanding of derivatives pricing through hands-on experimentation.