Introduction
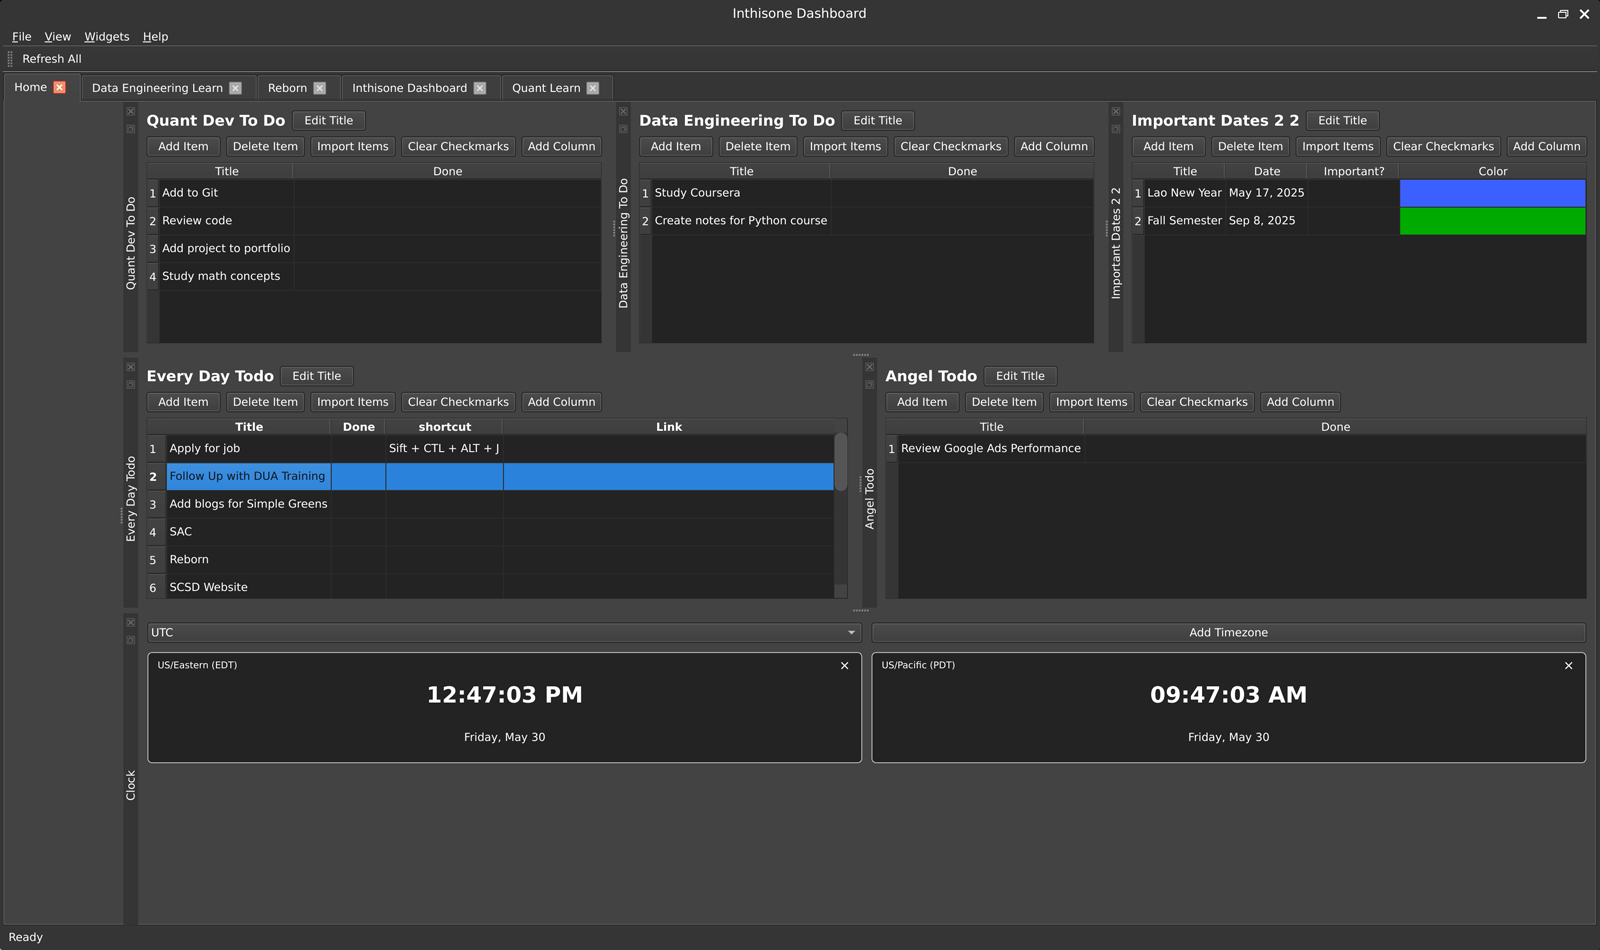
One night I got curious: if I were working as a quant developer, what kind of tools would I need at my fingertips? I didn't want a browser-based dashboard. I wanted something local, lightweight, and tailored to the way I think. That's when I started building Inthisone Dashboard, a Python-based desktop app that mimics the kind of internal tools quants might build for themselves.
I didn't know the "best practices" or what tools big firms used. I just started building.
Turns out that's where the real learning started.
Repository Access
This project is private. Contact me to request access to the repository.
Key Components
This thing's built with:
- PySide6 (Qt6) for UI
- A plugin system for adding and managing widgets
- SQLite for layout persistence and storing configs
- AsyncIO for non-blocking data updates
Functional widgets I built:
- Clock (because why not)
- Markdown viewer
- Tree list and custom list widgets
- WYSIWYG editor (barebones, but it works)
- REST API table widget that fetches and updates
- Code viewer with syntax highlighting
I used patterns like Factory, Observer, and Strategy to make widgets modular and updateable without restarting the whole app.
What Went Wrong
I'll be real—this wasn't a clean win.
- The UI got sluggish fast with a few widgets polling data
- The plugin system became too messy without clear interfaces
- Performance sucked across platforms
- It didn't feel like something I'd trust to run live signals
I realized I jumped in too fast without researching what other quant teams use. If I were at a place like Engineers Gate, where people are doing serious work with latency and data throughput, I'd never ship this.
Still, this "failure" showed me what actually matters when building internal tools:
- Clean state management
- Real-time data architecture
- UI/UX that doesn't get in the way of thinking
What I'd Do Differently
Next time, I'd use a stack like:
- React + TypeScript for frontend
- Plotly.js or Highcharts for visualizations
- FastAPI or even Rust for the backend
- ClickHouse or DuckDB for real-time analytics
- WebSockets or Kafka for pushing live data
If I needed desktop functionality, I'd reach for Tauri or Electron instead of Qt.
The point isn't to chase the trendiest stack—it's to make something fast, maintainable, and intuitive under pressure.
Takeaway
This was never about building the perfect dashboard. It was about learning how quants think, how their tools work, and what decisions matter when designing a platform for real-time trading insight.
I didn't succeed in building something I'd use in production—but I did learn how to recognize what "production" should feel like. That's a win in my book.
Bonus
All design decisions, architecture patterns, and development notes are documented in a folder called memory-bank/, broken down into:
projectbrief.mdsystemPatterns.mdtechContext.mdprogress.md
Because if I build something, I want to understand it fully—even if I throw it away later.